|
|
|
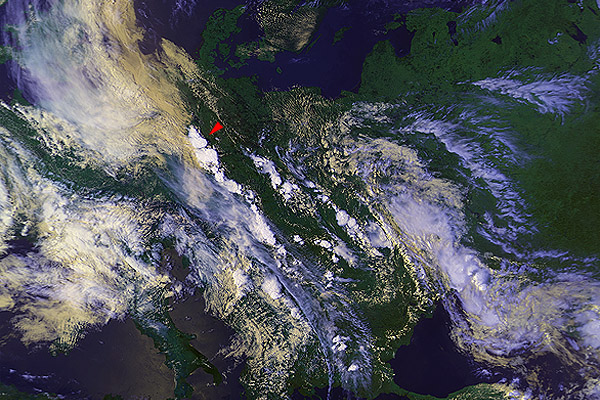
4 June 1984 1342 UTC NOAA 7 Germany, Erfurt area (Thüringen region) |
|
|
|
|
Since this is the first case you are looking at which utilizes the JavaScript Mouse Over function, let me spend few words about how to use this module. As you have probably already noticed, placing the cursor over one of the blue buttons on the left side of your screen results into three things: the color of the button changes from blue to red (which indicates that this button is active); the contents of the status bar (at the bottom of your navigator window) changes; and - most important of all - the corresponding channel (or composite image) is displayed in the image window. You should have the screen size set to 800x600 or better, otherwise you will not see the entire image window together with the buttons. Moreover, to see all the fine details of the storm cloud tops, your screen should be set to 24 bit graphics ("True color" or "16.7 M colors"). Since almost all recent computers support this resolution, I apologize to those who still might be using the 640x480 mode. "Clicking" at the buttons is not activated at this version, perhaps it will be utilized in the future. The only exception from this is the BACK button - clicking it will take you back to the main document... You don't have to switch between the spectral channels only in the order how the buttons are displayed. For example, here you can try the following: place the cursor over the ch1+2+4 button, pull next the cursor right (outside of the "button area"), then go down and directly to the ch3enh button. This will result that the channels 1, 2 and 4 composite image will be replaced instantly by the enhanced channel 3 image, without displaying the other ones. This way you can switch directly from one spectral band (or composite image) to a different one as you desire. If you are using higher resolution than the 800x600 one, you can also "skip" from one button to another one using the blank space on the left side of your screen. The storm, which is shown in the detailed images, is in the larger scale location image marked by red arrow. In some cases you will find the red arrow also in one of the detailed images (typically in the ch1+2+4 composite image) - this is applied when there are more storms in the area and when it might not be as clear which is the one that is discussed in the text. In this first case I decided to show not only the enhanced channel 3, but also the original channel 3 image without any special enhancement - just to show the effect of enhancement (contrast stretching). In most of other cases you will find only the enhanced channel 3 image (ch3enh). In some cases (namely later in the "Plumes" section) you will find also some other composite images, not only the combination ch1+2+4. While the ch1+2+4 composite image is rather "just a pretty picture", not bringing too much new information than the individual spectral band images, the ch3+4 composites show nicely the correlation between individual features in these two bands (almost as "3D" images) - more about this later. Now few remarks for this particular case. In the ch1+2+4 composite image the yellowish shade of clouds means that these are low to middle level clouds, Cb tops are displayed in white and high cirrus clouds are shown in bluish to white - depending on the optical thickness of the layer (these are common remarks valid for all cases). The channel 2 images are slightly enhanced to show details of the cloud tops, resulting thus in somewhat darker display of land. Channel 4 images are in most cases shown in "conventional" black and white mode (channel 4), together with the color enhanced image (ch4enh). Here, in the color enhanced image you can notice that the arrowed storm exhibits a feature which is often described as "cold-U" (given its shape) with a warmer area inside - features which are considered typical for severe storms. The channel 3 image enhancement is discussed in detail in the main text; here you can notice that the arrowed storm in the original channel 3 image is only slightly darker than other storms, which can easily escape your attention. However, in the enhanced channel 3 image (ch3enh) the darker shade of the storm is obvious. All the other storms on this image exhibit only typical, low values of the 3.7 µm reflectivity (thus are displayed in white in the ch3enh image). |